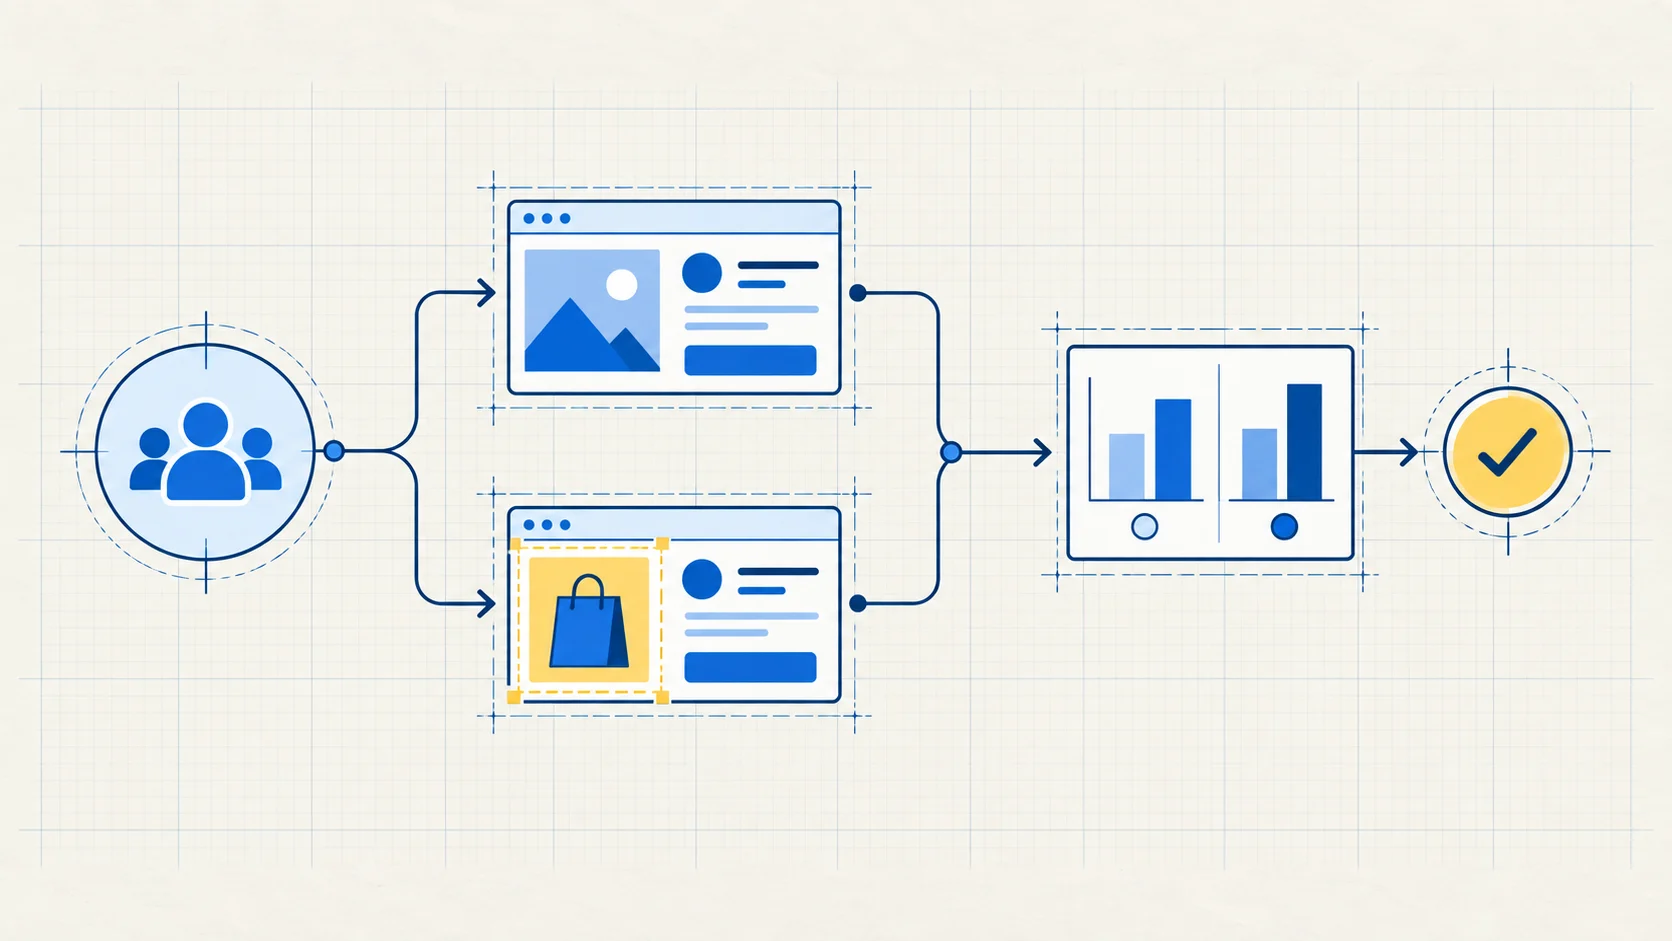
A lower cost per lead does not necessarily mean a lower cost per sale—or a better economic result for the business.
Cost per lead (CPL) tells you what you paid to generate an enquiry. It does not tell you whether that person was a fit, attended a call, bought, paid, or could be served profitably. A useful comparison keeps each lead cohort connected to its downstream outcomes instead of separating the advertising report from the sales record.
That changes the decision. Do not ask only, “Which campaign produced cheaper leads?” Ask, “What happened to the leads from each message, and what did it cost us to acquire and fulfil each sale?”
Three costs that answer different questions
Cost per lead is ad spend divided by the number of leads. It answers: how much did we pay for each enquiry?
Ad-spend-per-sale is ad spend divided by the number of sales attributed to that cohort. It answers: how much advertising spend did each sale require?
A more complete acquisition-cost calculation can include creative production, sales labour, software and other relevant acquisition costs. Which costs belong in the calculation depends on the decision you are making and your accounting approach.
Do not label ad-spend-per-sale as fully loaded acquisition cost. The narrower figure can still help you compare campaigns, but it does not represent the complete cost of acquiring a customer.
A worked hypothetical: the $20 lead and the $50 lead
The following figures are invented teaching arithmetic, not campaign results, forecasts or benchmarks.
| Measure | Campaign A | Campaign B |
|---|---|---|
| Ad spend | $2,000 | $2,000 |
| Leads | 100 | 40 |
| CPL | $20 | $50 |
| Qualified leads | 10 | 24 |
| Attended calls | 4 | 16 |
| Sales | 1 | 4 |
| Ad-spend-per-sale | $2,000 | $500 |
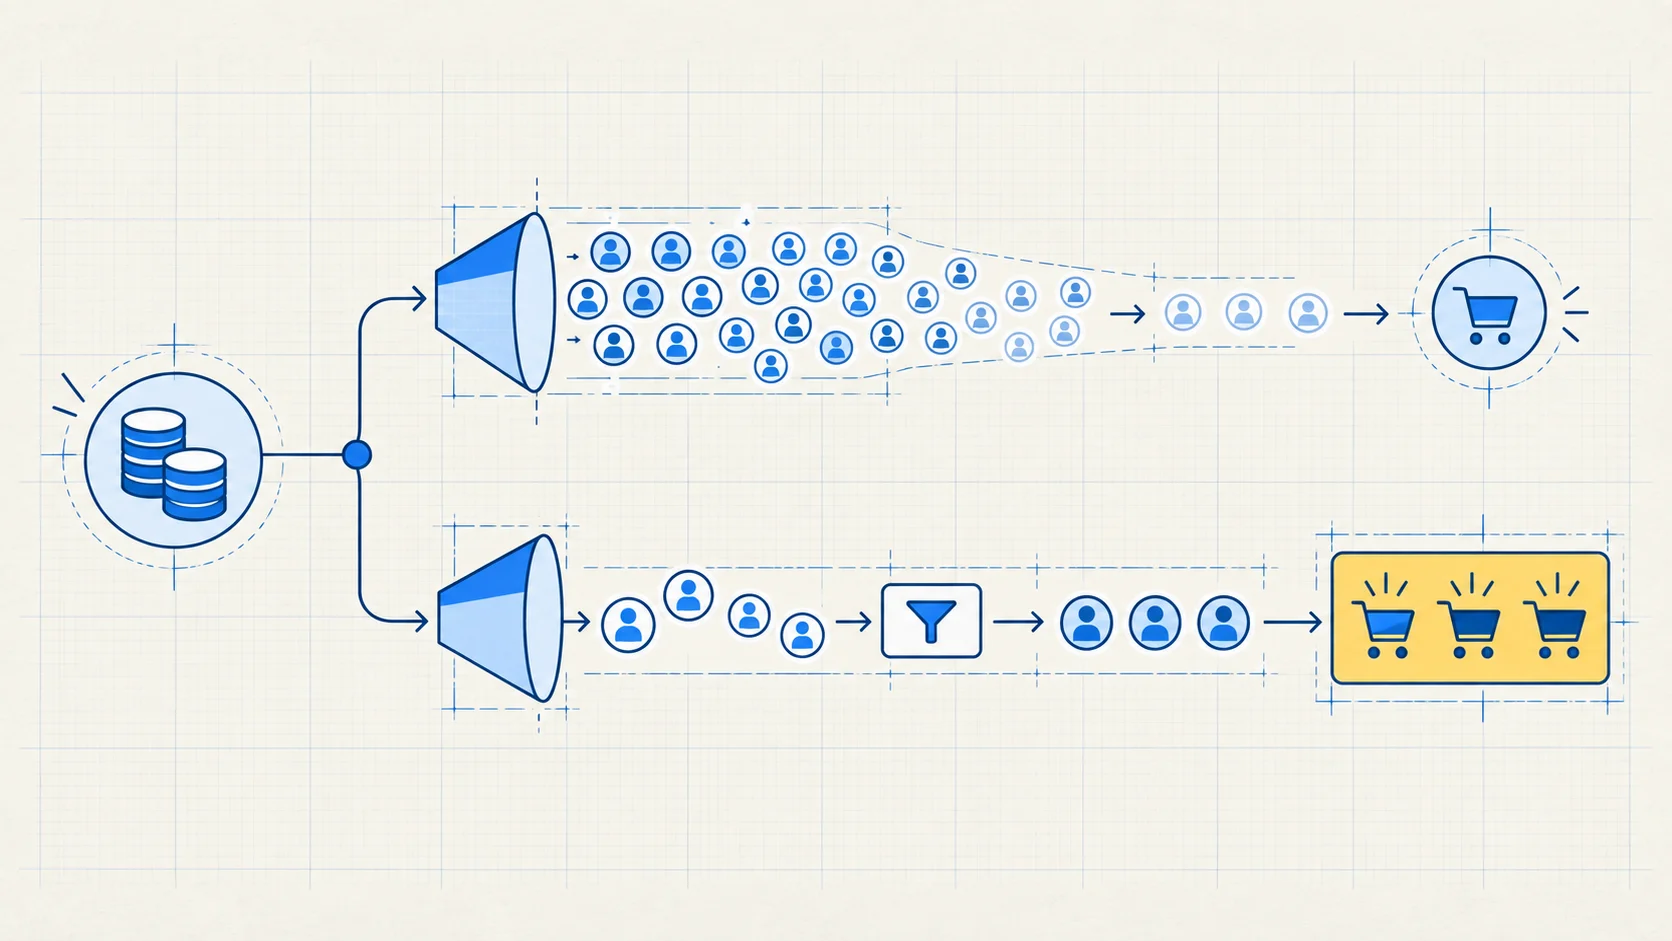
Campaign A appears better when the comparison stops at CPL: $20 rather than $50. But Campaign B produces four sales from the same hypothetical spend, making its ad-spend-per-sale $500 rather than $2,000.
The conclusion is not that expensive leads are better. It is that CPL alone cannot settle the question. Campaign B is preferable only if the sales are genuinely comparable and the wider economics and operating constraints still make sense.
For example, you would still need to examine:
- whether both cohorts cover the same time window;
- whether “lead,” “qualified,” “attended” and “sale” mean the same thing in both reports;
- whether the sales have similar collected revenue, retention and fulfilment requirements;
- whether creative, sales labour, software and other acquisition costs differ; and
- whether your team has capacity to follow up with and serve the additional customers.
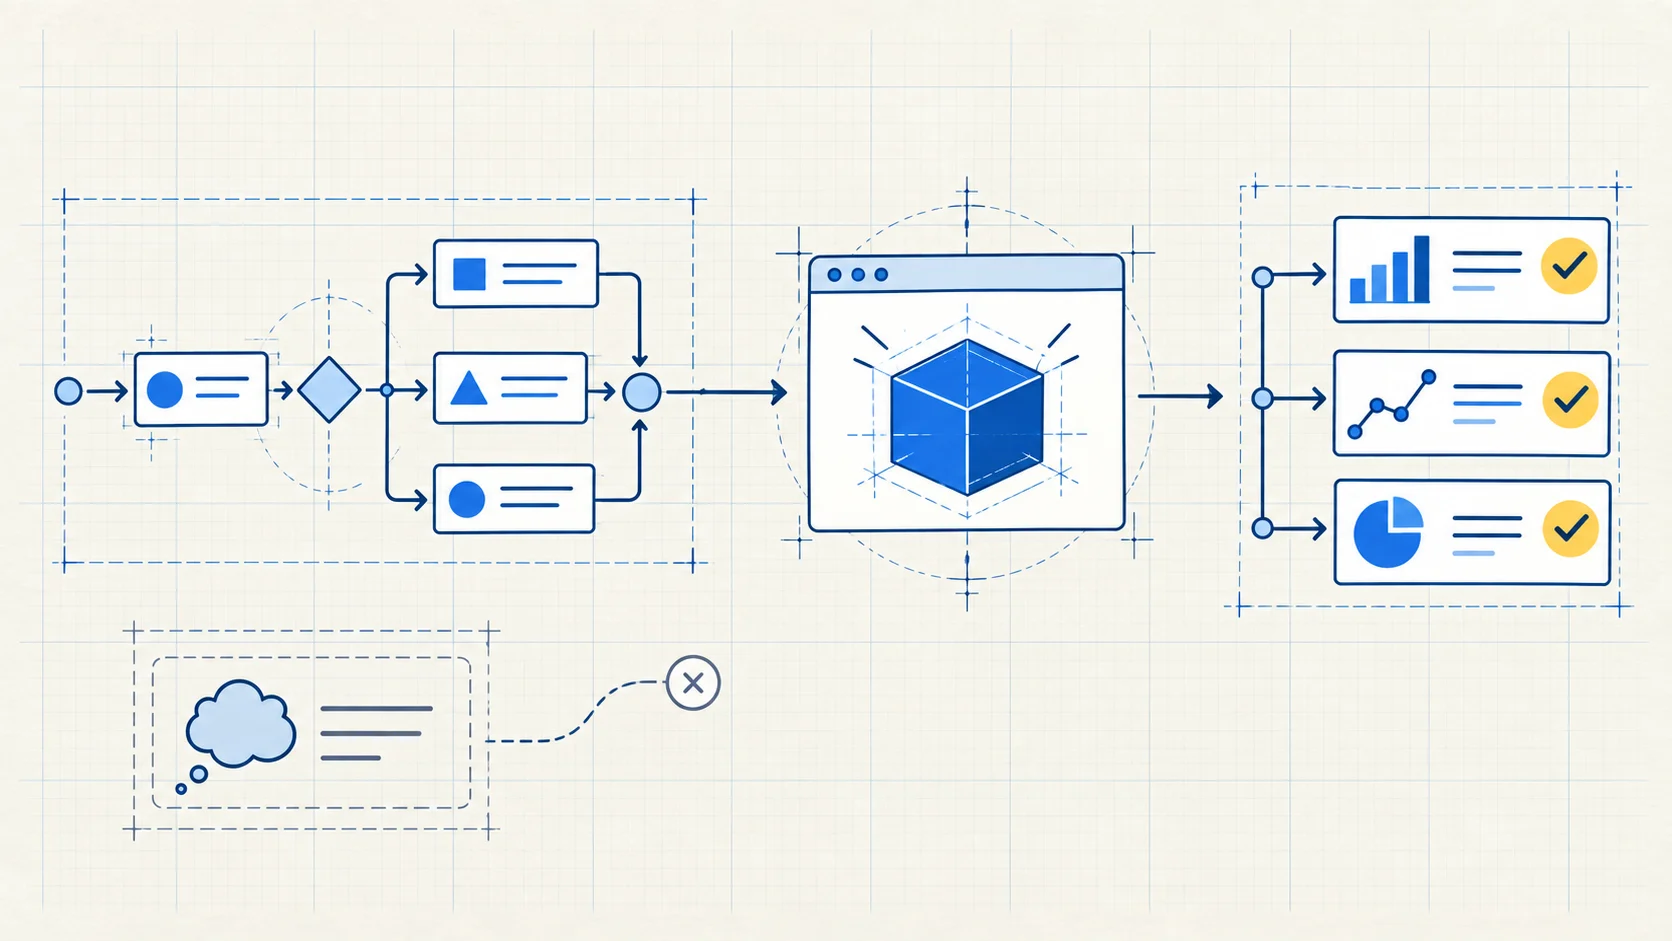
The reviewed Scale Manual worksheet follows the chain from spend through leads, qualified leads, scheduled calls, attendance and sales, then continues to collected cash, fulfilment cost, lifetime value and net profit. You may not have reliable data for every field yet. Recording what is unknown is better than quietly treating it as zero.
Why lead quality begins before the form
Before treating a low close rate as a sales problem, review whether the invitation matches the situation, need, timing and readiness you intend to address.
Wording cannot prove that someone has money or is qualified. It can, however, make a relevant operating situation and expected participation clearer before the click.
Suppose an ad promises simply “more leads for your business.” That broad invitation may generate enquiries from businesses with very different problems. A more specific hypothetical invitation might address an established service owner who relies on referrals, has capacity for suitable work and needs a clear follow-up owner. That wording does not certify fit or ability to pay. It gives the right reader more information with which to recognise—or reject—the invitation.
This is why the originating message should stay attached to downstream outcomes. If one message produces fewer enquiries but more suitable conversations, you need to see that pattern before rewriting the ad or increasing spend. That is the practical value of full-chain measurement: it helps you choose the next change, not merely describe the top of the funnel.
Decision aid: what should you do next?
Use this table after comparing equivalent cohorts.
| What you observe | What it may mean | Sensible next move |
|---|---|---|
| Low CPL, but few leads qualify | The invitation may be too broad, or your definition of a lead may be weak | Review the opening, promise and CTA before adding form friction |
| Many qualified leads, but few attend | The booking, confirmation or follow-up transition may be failing | Trace the handoff and assign a named owner |
| Strong attendance, but few sales | The offer, expectations, sales conversation or qualification may be misaligned | Review recordings or notes and classify the reasons without guessing |
| Higher CPL, but lower ad-spend-per-sale | The campaign may be attracting fewer but more suitable enquiries | Check collected value, wider acquisition costs, fulfilment and capacity before scaling |
| Lower ad-spend-per-sale, but costly fulfilment | Acquisition looks efficient while the overall customer economics may not be | Compare contribution after relevant fulfilment costs |
| Records disagree across advertising, CRM and finance systems | The apparent winner may be a measurement artefact | Reconcile definitions, attribution rules and time windows before changing the campaign |
Treat each row as a diagnostic prompt, not a verdict. Treat patterns from small or incomplete cohorts cautiously, and investigate more than one possible cause.
A simple review sequence
For each campaign or message, record:
- The cohort and time window.
- Spend and lead count.
- Qualified leads, scheduled calls, attendance and sales.
- Collected revenue and relevant fulfilment cost, where available.
- Other acquisition costs included—and explicitly excluded.
- Capacity constraints or follow-up failures that affected the result.
- One next action, an owner and a review date.
The final line matters. A report is useful when it supports a responsible decision: hold the campaign steady, investigate a broken transition, revise the invitation or run a controlled test. Keep a record of what you changed so you can interpret the next comparison.
The practical answer
If the evidence is incomplete, improve the measurement before treating a CPL difference as a business result. Use comparable downstream outcomes, complete-enough costs and your ability to follow up and fulfil the work to decide whether to hold, investigate or test.
I have spent thousands of hours studying marketing; my aim is to turn that learning into practical steps you can use. If you want to build and operate your own lead system, start with the review sequence above. If you would rather have help building a system you control, explore whether Scale Manual is a fit for the research, structure, implementation and documentation your business needs.